Supply & Demand Snapshot
Source: World Gold Council, Metals Focus, ICE Benchmark Administration. n.m. = not meaningful.
1. Market Overview: A Year of Dual Records
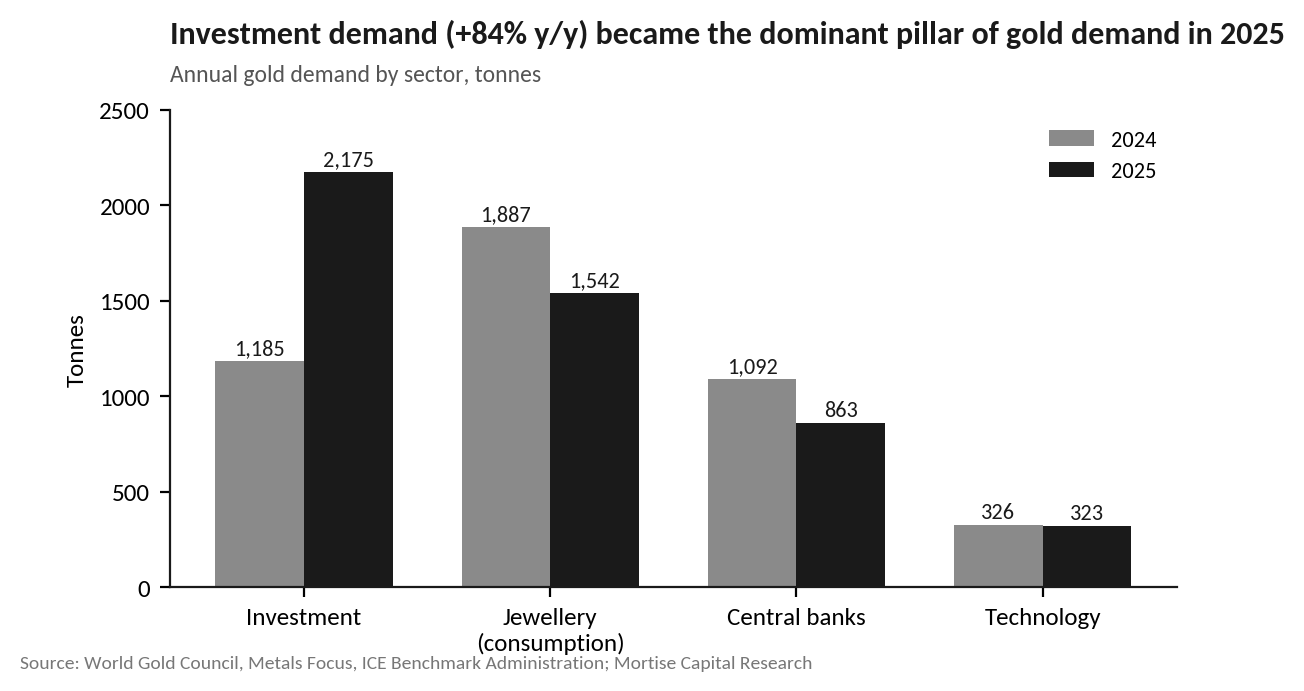
2025 was the first year in which volume and value records were set simultaneously. Total demand including OTC reached 5,002t, while the 44% rise in the average price lifted the market's dollar value 45% to US$555bn. Crucially, growth was not broad-based — it was a rotation: investment expanded by nearly 1,000t while jewellery contracted by roughly 345t and central bank purchases eased by 229t. The composition of gold demand has shifted decisively from consumption toward financial allocation.
Q4 underlined the momentum: quarterly demand of 1,303t was the strongest fourth quarter on record, driven by 175t of ETF inflows and 420t of bar & coin buying — itself the strongest single quarter in over 12 years. The October price dip was bought aggressively, producing a record second half for combined ETF and retail investment (1,141t).
2. Investment: The 800-Tonne Swing
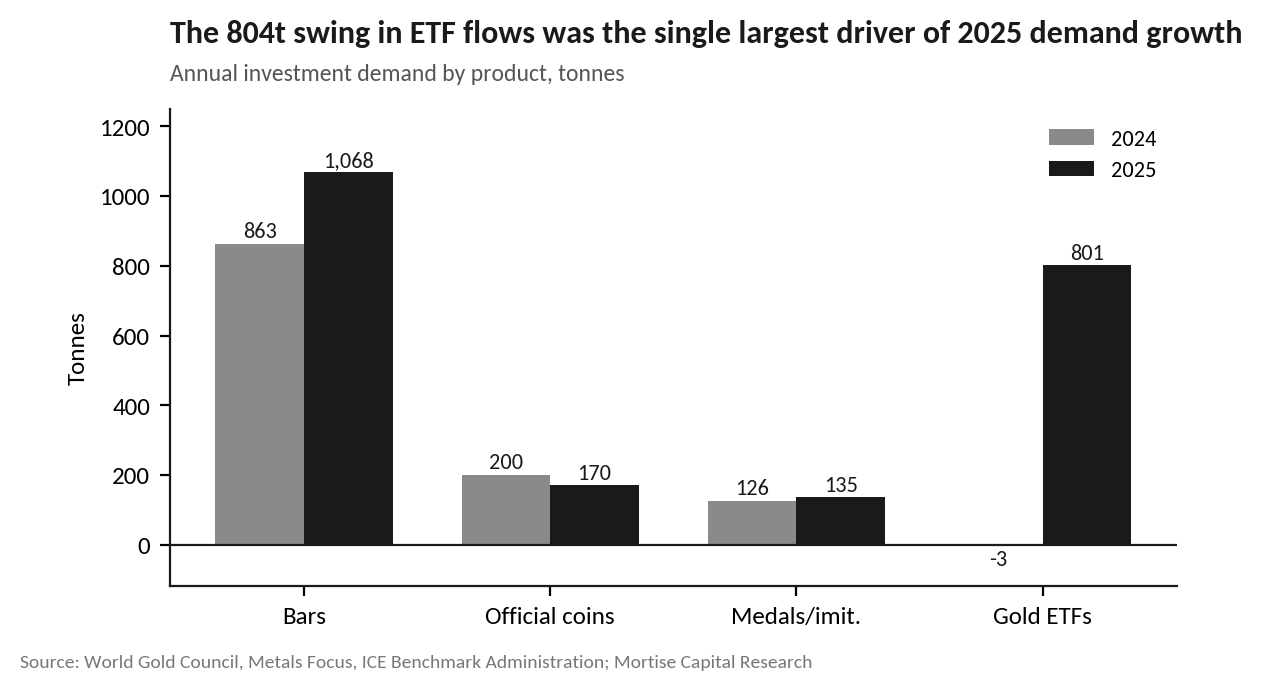
Annual investment demand of 2,175t broke the 2020 record by a wide margin. The decisive variable was ETFs: after a flat 2024 (-3t), global holdings grew 801t to an all-time high of 4,025t, with record dollar inflows of US$89bn. North America absorbed more than half the increase (+446t; US$51bn), with Asia second (+215t; US$25bn) as Chinese-listed holdings more than doubled (+133t) and India closed the year on an eight-month run of inflows. European buying (+131t) was comparatively light, dragged by October profit-taking.
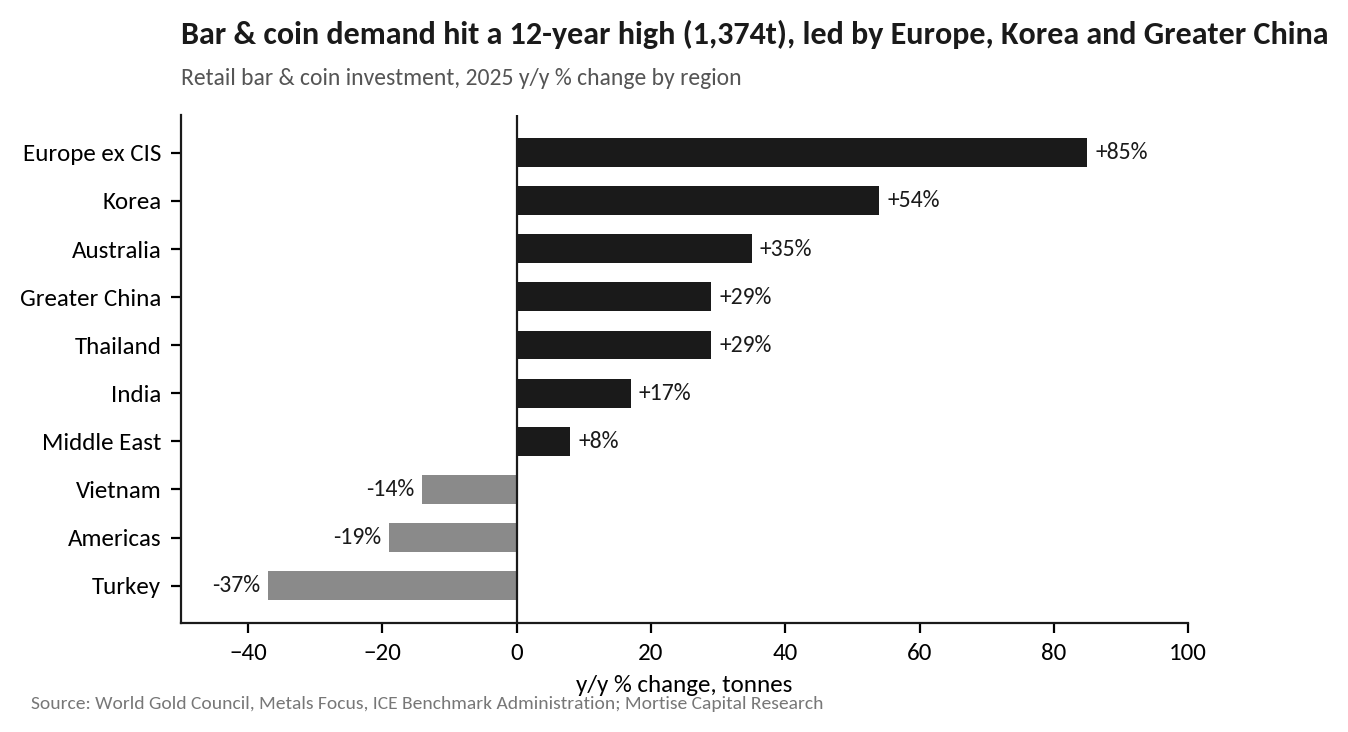
Bar & coin demand of 1,374t was the highest since 2013, worth a record US$154bn — over half from India and China combined. China's retail investment (432t, +28%) exceeded its jewellery consumption for the first time in the data series, aided by November's VAT reform pushing investment-minded buyers from jewellery to bullion. India (280t, +17%) posted consecutive 90t+ quarters for the first time since 2013. Europe ex-CIS jumped 85%, led by Germany (+167%); Korea (+54%) saw a record quarter after the central bank floated reserve purchases. Turkey (-37%) and the US (-25%) were the main exceptions, on inflation erosion and two-way profit-taking respectively.
Drivers were consistent across regions: safe-haven and diversification motives (geopolitics, dollar weakness, stretched equities, expected rate cuts) amplified by price momentum itself. Notably, COMEX managed-money positioning fell 173t against the trend — leaving speculative positioning light and reinforcing that the rally has been driven by strategic physical and ETF allocation rather than leverage.
3. Central Banks: Slower, Not Smaller in Spirit
Official purchases of 863t came in at the upper end of WGC's expected range but below the exceptional 1,000t+ prints of 2022–24. The deceleration appears price-sensitive rather than strategic: buying re-accelerated into Q4 (230t, +6% q/q) and sellers were nearly absent all year — Singapore (-15t) and Russia (-6t) the only notable reductions. Twenty-two institutions added a tonne or more; 57% of the annual total was unreported, indicating substantial opaque accumulation continues.
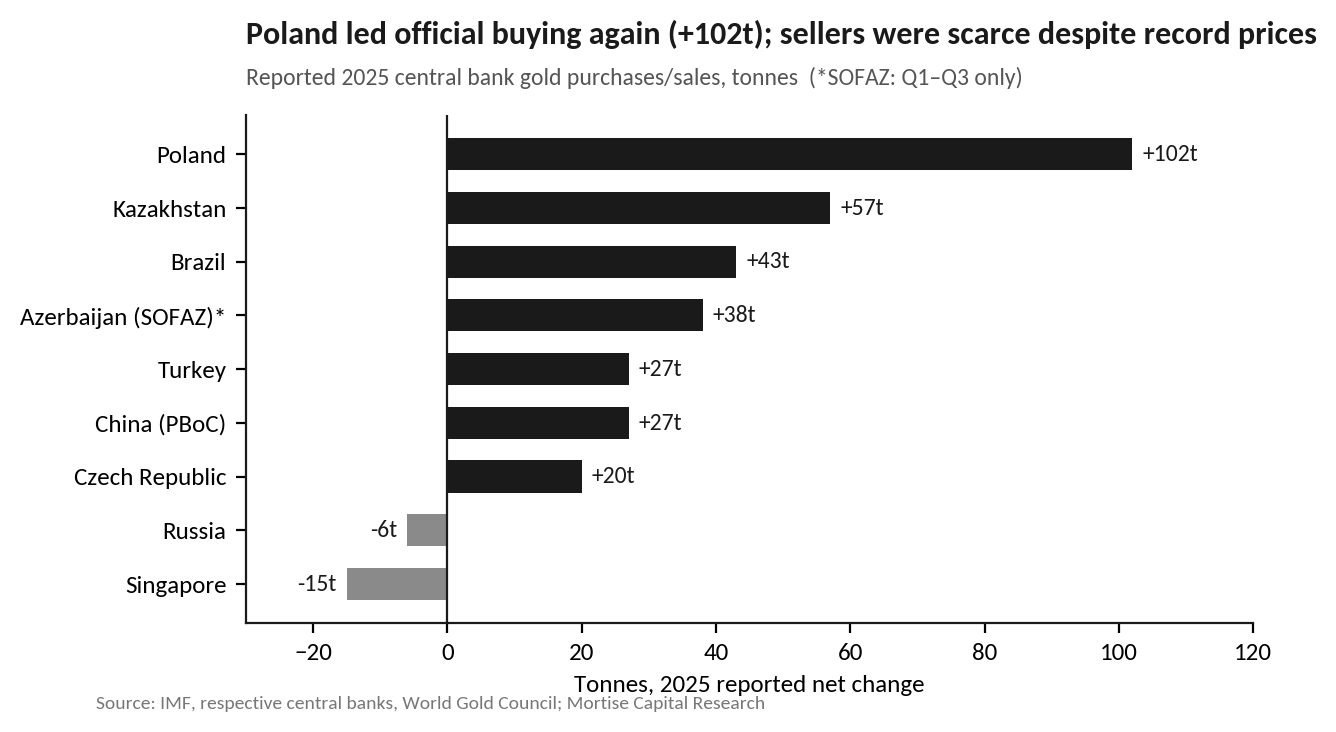
Poland was the standout for a second straight year (+102t to 550t; gold now 28% of reserves vs. a target raised to 30%, with the Governor signalling 700t as a longer-term goal). Kazakhstan added 57t, its largest annual purchase since 1993; Brazil re-entered after four years (+43t, gold still only 7% of reserves); the PBoC's reported +27t likely understates its true activity. IMF COFER data shows gold's share of global FX reserves only now approaching early-1990s levels — supporting WGC's case that the structural reallocation has room to run.
4. Jewellery: Cutting Grams, Not Budgets
Jewellery consumption fell 18% to 1,542t, a five-year low, with declines in every market — an unavoidable arithmetic consequence of the price. The more informative signal is value: global spend rose 18% to a record US$172bn, and rose in every market. Consumers maintained or increased budgets while accepting lower fine weight — lighter pieces, lower carats in some markets (14k traction in urban north India; sub-14k in Indonesia), and trade-ins of old jewellery to fund new purchases.
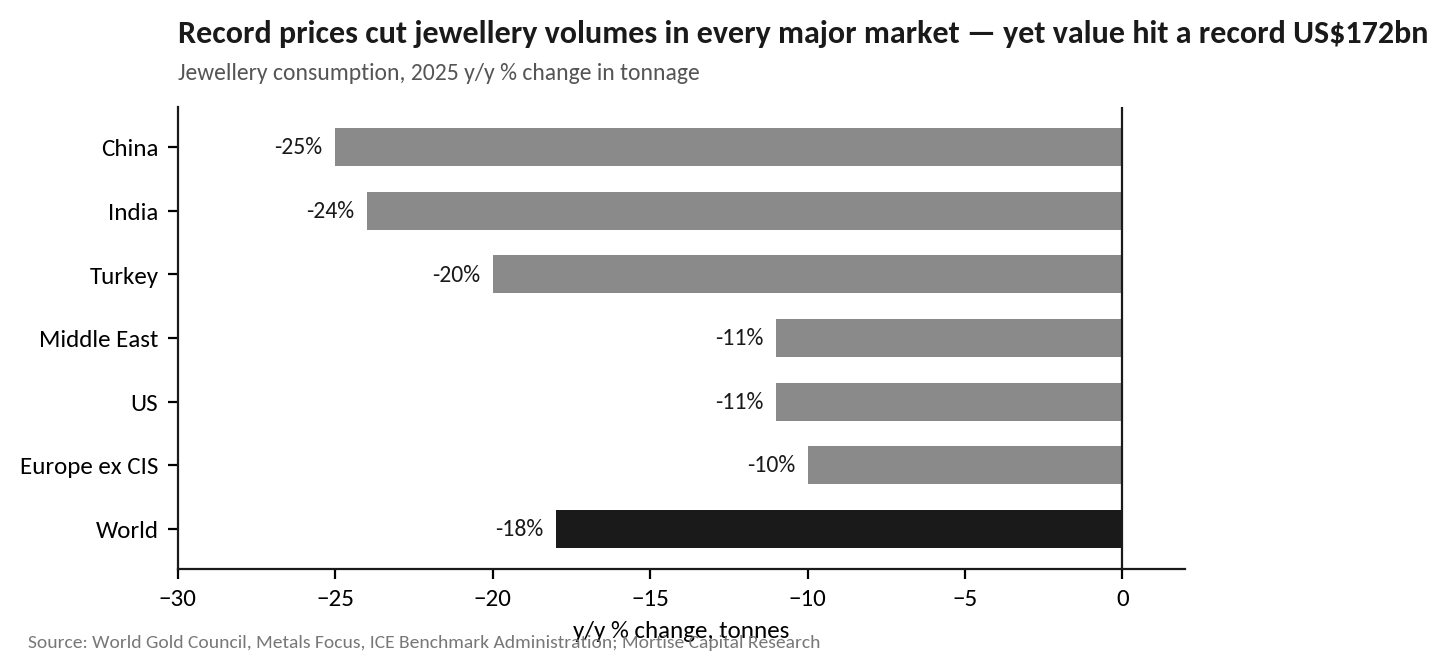
China (-25% to 360t, a 15+ year low) faced a compounding mix of record prices, a soft economy, a late New Year, and November's VAT change that taxed jewellery and redirected demand to bullion — yet annual spend of US$39bn was the second highest on record. India (-24% to 431t) saw record value of US$49bn, with Q4 spend alone a record US$19bn; gold-backed retail loans surged 125% y/y to US$40bn, evidencing monetisation rather than abandonment of holdings. Turkey fell to its lowest volumes since 2020 under local premiums of up to US$300/oz. The US (-11%) showed a K-shaped pattern: resilient high-end demand, reduced fine weight in the mass market.
5. Technology: AI Holds the Line
Technology demand was essentially flat at 323t (-1%), with electronics unchanged at 270t. The AI build-out — bonding wire, interconnects, AI-server PCBs, HDI boards for LEO satellites — offset weakness in traditional consumer electronics, where AI demand has crowded out capacity and more than doubled memory prices in 2025. The squeeze cuts both ways into 2026: AI infrastructure supports gold content per unit, while memory shortages and rising device prices threaten smartphone and PC shipment volumes. At US$3,400+/oz, thrifting and substitution R&D is accelerating across the sector — a slow structural leak worth monitoring.
6. Supply: The Silent Bull Case
Total supply rose just 1% to 5,002t against a 44% price rise — a strikingly inelastic response. Mine production edged to an estimated record 3,672t (subject to revision), but ten-year average growth remains below 1% annually and Q3 AISC rose 9% y/y to US$1,605/oz. The hedge book fell to ~120t, the lowest since 2013, and new hedging is shifting toward purchased puts rather than sold calls — miners are paying for floors while keeping upside, a clear statement of internal price conviction.
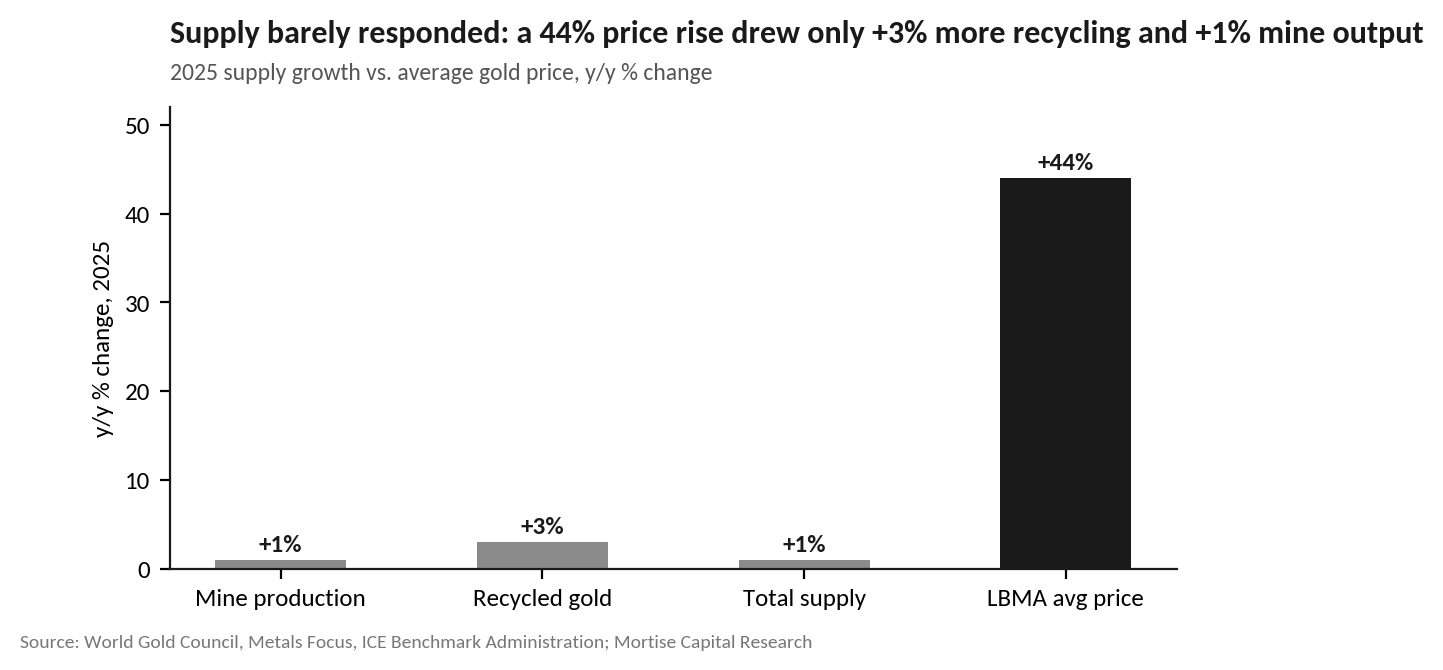
Recycling is the more important constraint. Supply rose only 3% to 1,404t; WGC quantifies the structural break — since mid-2022, a 1% price change has drawn roughly 1.6t of recycling versus 4.8t historically, a two-thirds collapse in price elasticity that survives controls for distress and price expectations. Holders are not selling because they expect higher prices and face no economic distress; in India, trade-ins and gold-collateral lending divert metal from outright scrap. Effectively, a geopolitical premium is embedded on the supply side as well as the demand side. The main reversal risk is a sharp growth slowdown forcing distressed selling.
7. 2026 Outlook & Mortise View
WGC base case
• Another year of strong ETF inflows and robust bar & coin demand, underpinned by elevated (near-2025) central bank buying.
• Jewellery tonnage to stay weak in a persistently high price environment; a flat year is the most likely outcome for China, with India's stronger macro offering more consistent support.
• Mine supply and recycling near 2025 levels — miners incentivised by record margins, but recycling firm yet structurally constrained.
Supportive macro checklist (per WGC)
• US 2-year real yields already down ~20bps in early 2026; further policy cuts expected.
• Credit spreads near historic lows with bond volatility threatening to rise; equities priced for perfection; the dollar expensive on a REER basis.
• Term premia rising alongside G7 geopolitical risk — gold's all-weather hedge case vs. fixed income remains intact.
• ETF capacity argument: US cumulative flows modest vs. past surges, European holdings well below peak, Asian demand only beginning to scale; Indian pension funds (NPS) newly permitted to hold gold ETFs; six Chinese insurers admitted to the SGE.
Mortise Capital interpretation
Our read of the report is that the gold market's marginal buyer has changed in kind, not merely in size. Demand leadership has rotated from price-sensitive consumption (jewellery) to price-insensitive or price-chasing allocation (ETFs, central banks, retail bullion), while both legs of supply have lost elasticity. That combination — inelastic supply meeting allocation-driven demand — explains how 53 all-time highs failed to trigger either meaningful scrap or official selling, and it skews the distribution of outcomes to the upside so long as the geopolitical premium persists.
Three watch items qualify the constructive view. First, momentum cuts both ways: with H2'25 investment at record levels and price-driven buying self-reinforcing, a corrective pullback on profit-taking is the most probable source of volatility, as WGC itself flags. Second, central bank price sensitivity is now demonstrated — official demand should anchor, not accelerate, the bid. Third, the jewellery floor matters: record value spend says sentiment is intact, but a second consecutive year of outsized price gains would test the 'flat 2026' assumption for China and compress the market's traditional shock absorber further. We would treat recycling elasticity (Chart 6 logic), monthly reported official purchases, and Asian ETF flows as the highest-signal trackers for 2026.
This document is an internal research interpretation prepared by Mortise Capital based on the World Gold Council's “Gold Demand Trends: Q4 and Full Year 2025” (January 2026). All underlying data are attributed to the World Gold Council, Metals Focus, Refinitiv GFMS and ICE Benchmark Administration. This material is for educational and internal research purposes only and does not constitute investment advice or an offer to buy or sell any security or commodity.