1. Why study oil through supply regimes
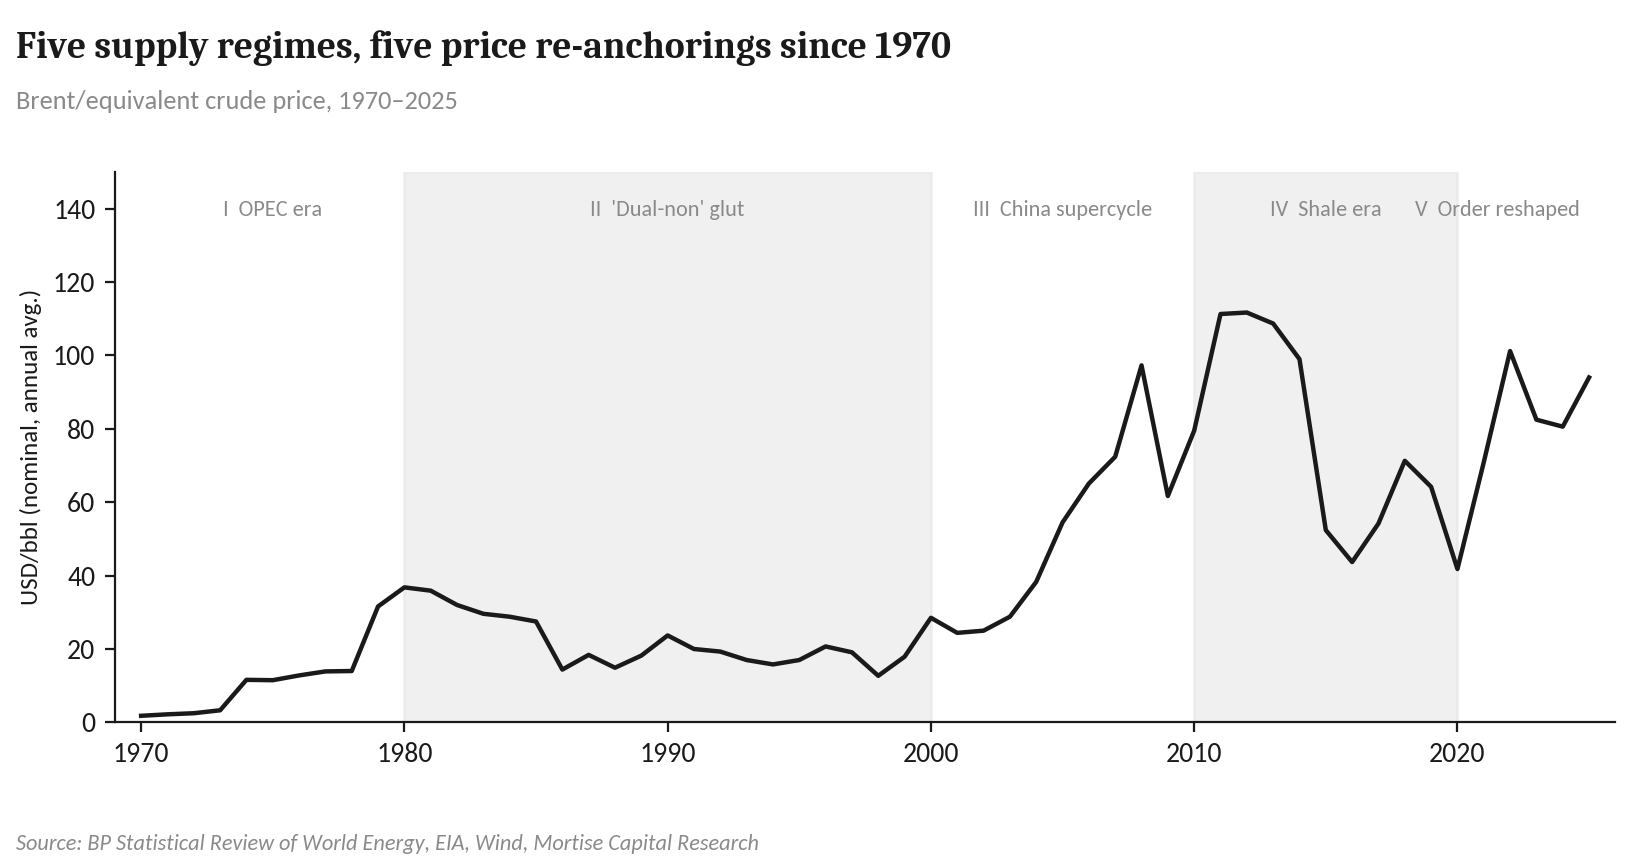
Crude oil remains the “mother of commodities”: the working fluid of the industrial system and a core variable in geopolitical bargaining. Each turn of the oil cycle is more than an adjustment in a supply-demand balance — it re-prices the global cost structure and, with a lag, redraws the map of where energy-intensive industry locates. This report reviews the five key phases of post-war crude, asking two questions: where does oil’s resilience as a strategic asset come from as the world’s energy intensity declines, and where will the price center re-anchor.
Our historical framework follows the five-stage periodization developed by CSC Research (CITIC Construction Investment Securities) in its June 2026 macro deep-dive on crude oil, which we adapt, restate, and extend here with our own charts and emphasis. Underlying data are drawn from the BP Statistical Review of World Energy, the IEA, the EIA, the World Bank, and Wind.
2. Stage I (1970–1980): peak Western industrialization meets the OPEC transfer
The macro backdrop was the summit of “traditional” industrialization in North America and Western Europe. Keynesian demand management, the baby-boom cohort entering adulthood, and two decades of post-war technological catch-up pushed industrial output to its absolute peak: German industry approached 50% of GDP, the UK around 40%, and the U.S. roughly 30% in the early 1970s — the highest readings since the industrial revolution, after which a fifty-year de-industrialization began. Steel output in the U.S., Germany, the UK, and France topped out historically in 1973–74.
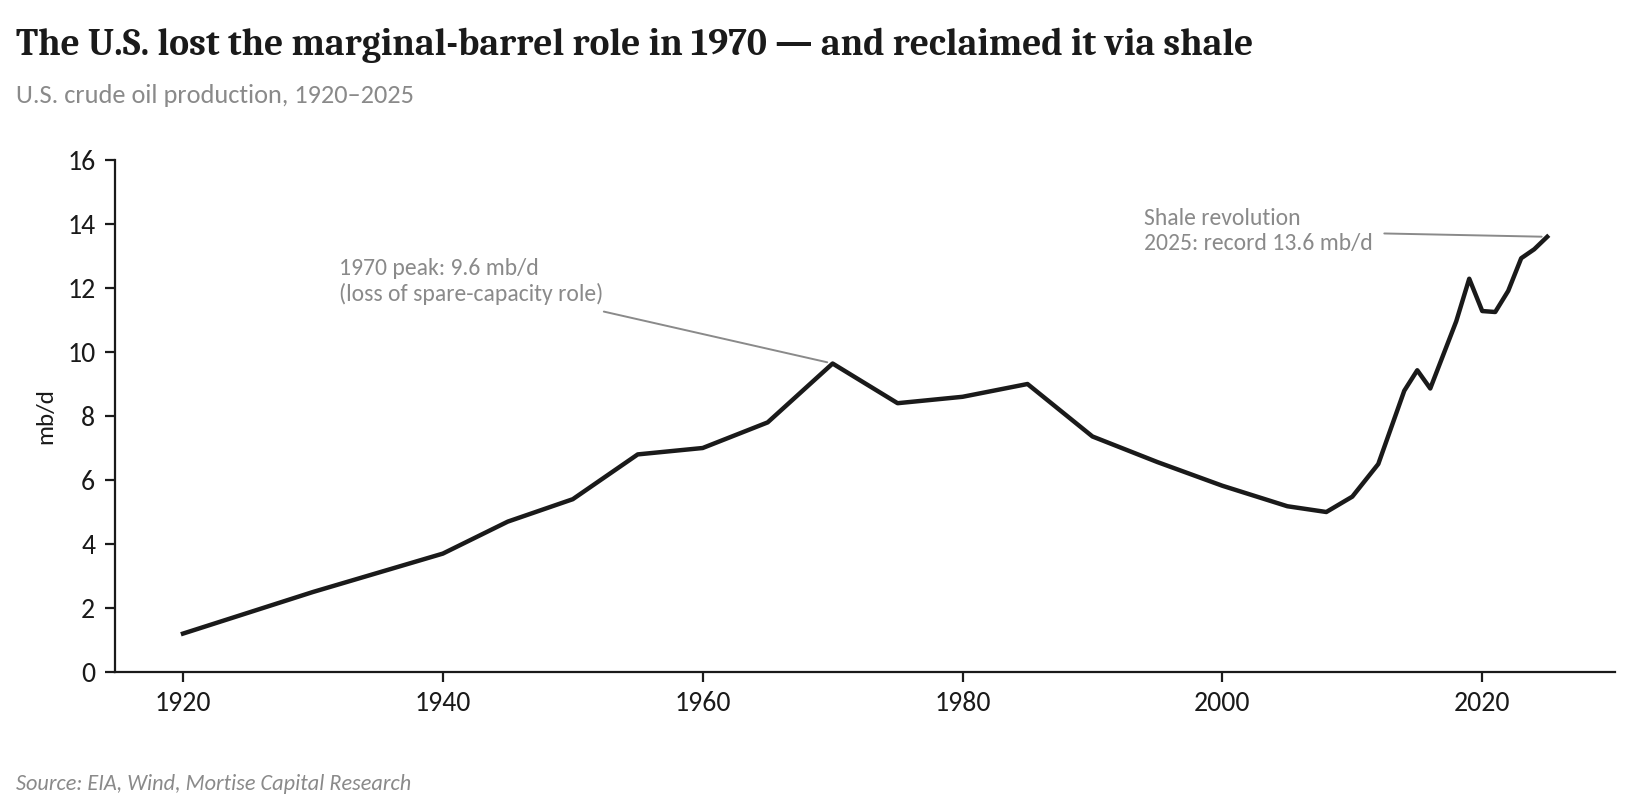
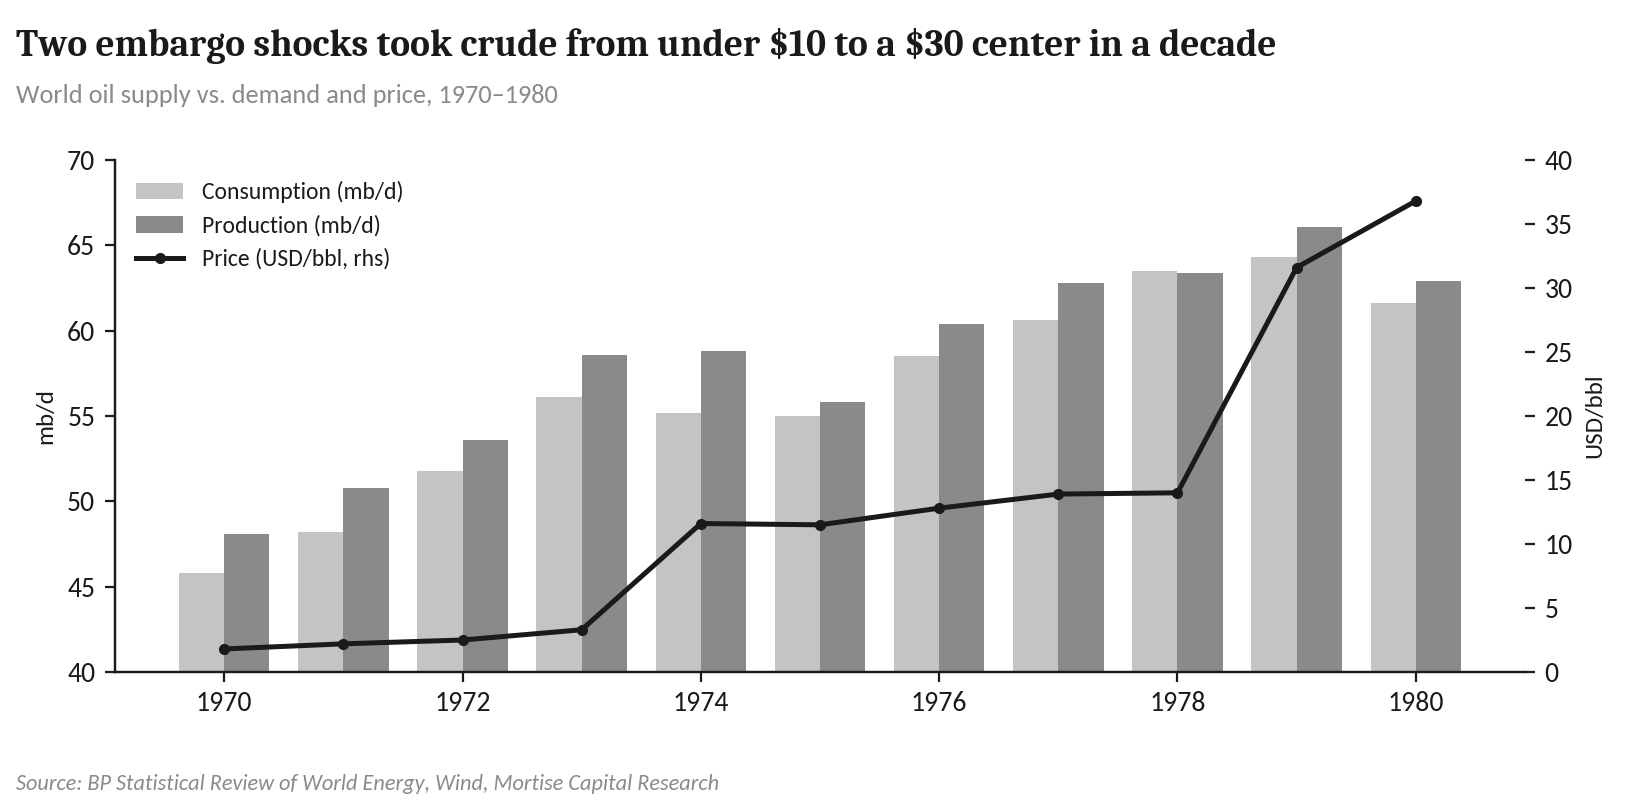
Supply power shifted from Western oil capital to resource-state sovereignty. The pivotal break came in March 1971, when U.S. crude production peaked and began to decline, ending the Texas Railroad Commission’s ability to buffer geopolitical outages with spare capacity. With the U.S. no longer the marginal producer, pricing power migrated to OPEC. The October 1973 Arab embargo removed roughly 5% of world supply and took prices from about $3 to near $12 per barrel within months; the 1979 Iranian revolution and the 1980 Iran–Iraq war delivered the second shock, lifting the center to roughly $30 by 1980. The collapse of Bretton Woods and the dollar’s credibility crisis amplified the move in financial terms, but the price following each supply event in a near-straight line confirms that the physical constraint was binding.
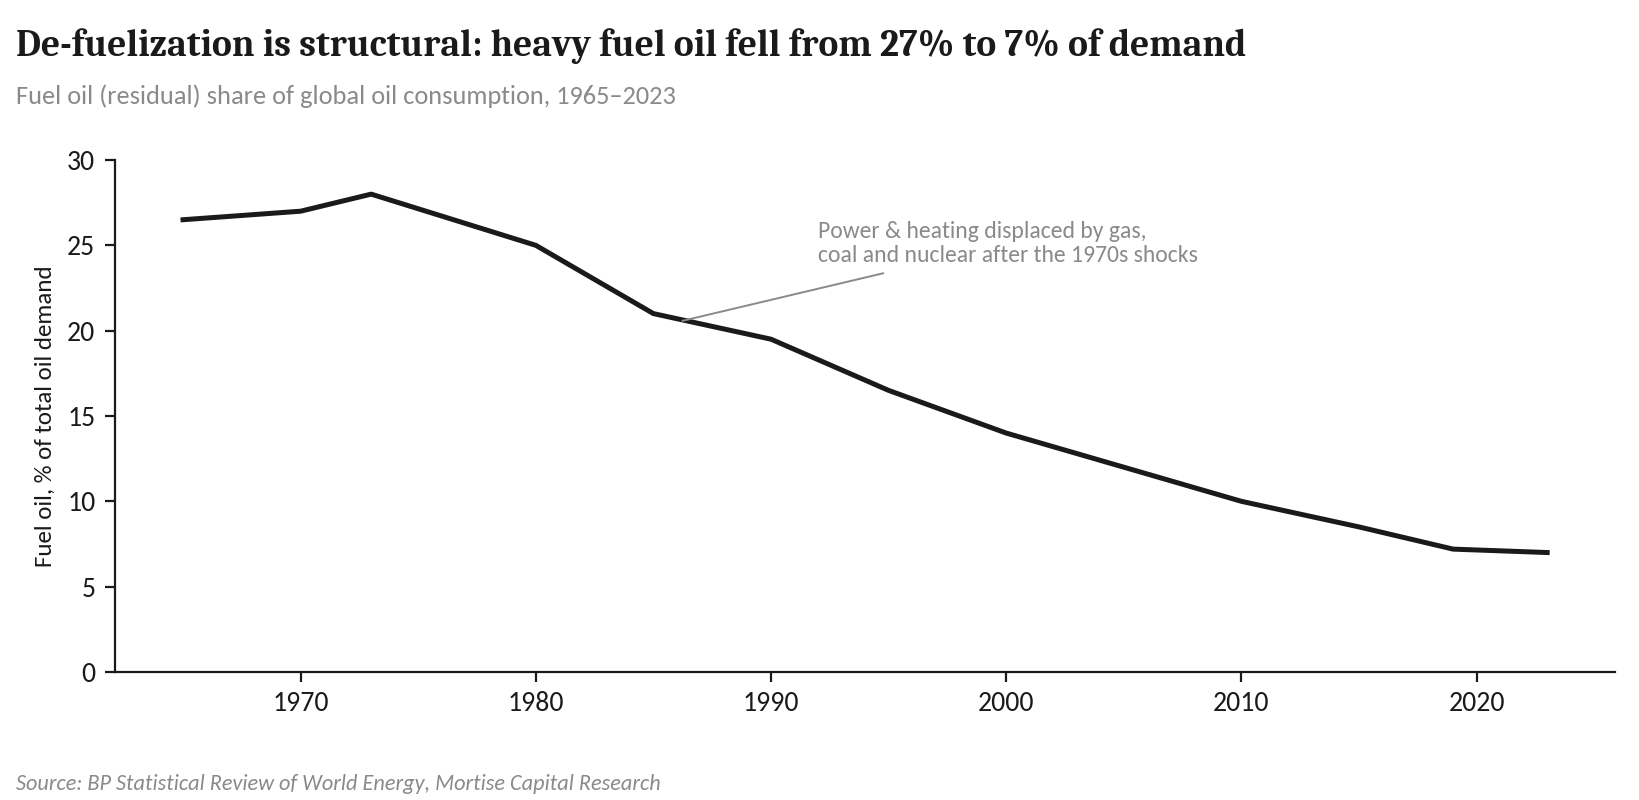
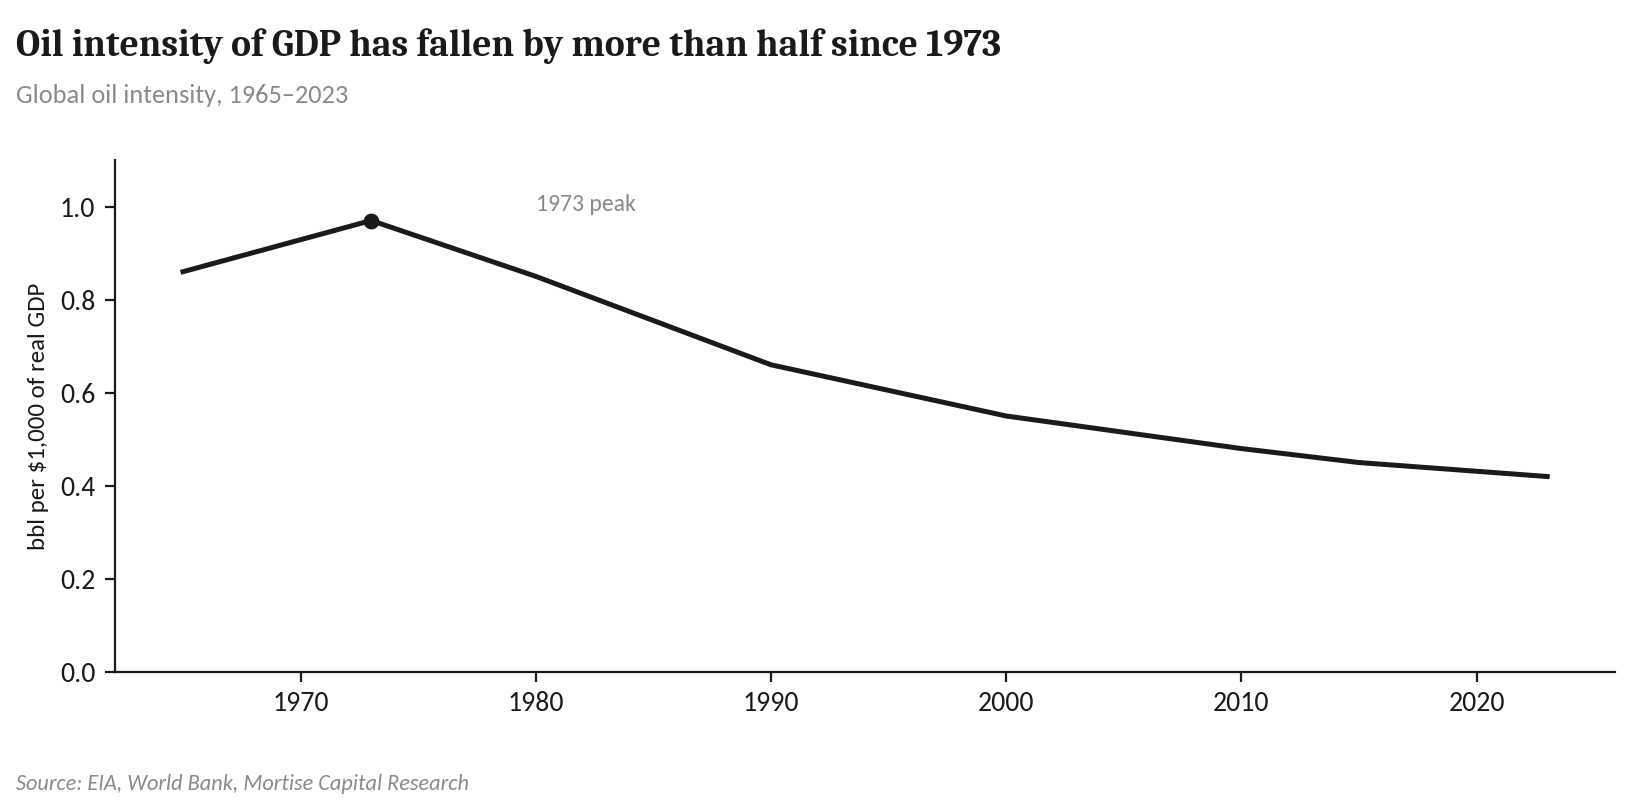
Demand was concentrated in the OECD and unusually fuel-heavy. World GDP grew above 5% a year through 1973 (6.4% that year), with the oil intensity of global GDP at its all-time high. A large share of crude was burned directly for power and heating — gas grids were immature and nuclear nascent — while pre-CAFÉ vehicles made no concession to efficiency. High prices eventually forced fuel-economy standards and substitution toward gas, coal, and nuclear, but conversion lags kept demand price-inelastic for most of the decade.
3. Stage II (1980–2000): the “dual-non” rebuild — non-OPEC supply, non-OECD demand
The Great Moderation reset the macro regime. Volcker’s tightening — and Greenspan’s subsequent anchoring of long-run inflation expectations — meant oil wobbles no longer fed wage-price spirals. Record-high real funding costs through the 1980s accelerated the migration of capital-heavy industry out of the OECD, while the Soviet transition collapse, Japan’s lost decade, and serial EM crises (Mexico 1994, Asia 1997, Russia 1998) stepped global GDP growth down a level versus the golden age.
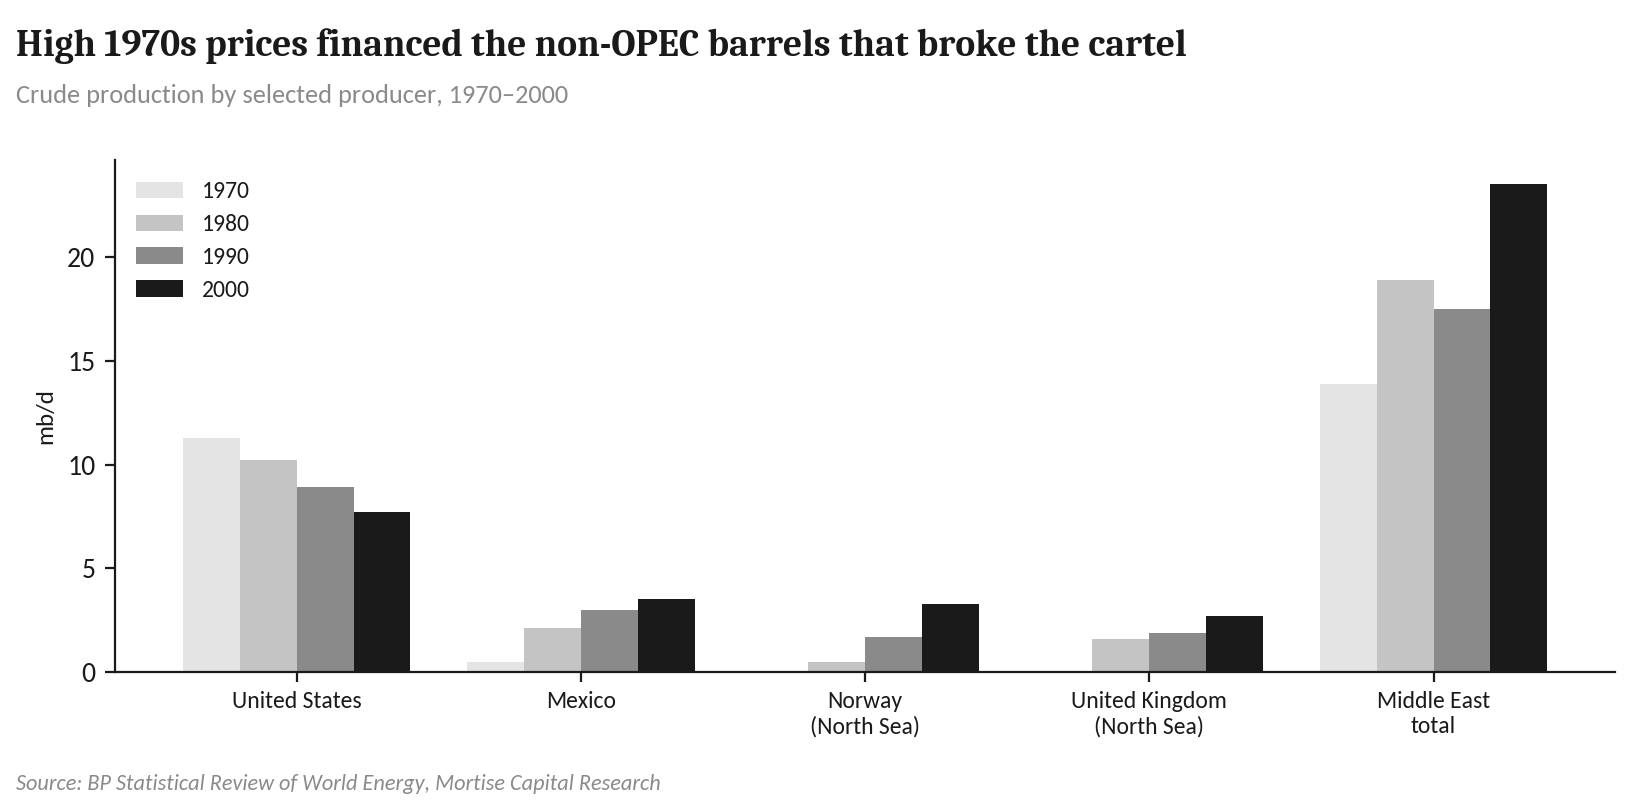
Non-OPEC barrels broke the cartel’s monopoly. Investment seeded by 1970s prices matured into North Sea, Alaskan, and Mexican output in the early 1980s — Alaska’s North Slope alone peaked at 2 mb/d in 1988. OPEC cut quotas repeatedly to defend price, with Saudi Arabia absorbing the swing-producer burden, until Riyadh abandoned price defense in late 1985 to reclaim share; crude broke below $10 in 1986. “Oil surplus” became the defining feature of the period, and chronic low prices in the 1990s sowed the under-investment that powered the next cycle.
Demand rotated east and toward transport. OECD oil intensity per unit of GDP fell roughly 20% between 1980 and 1990 as the West “de-oiled” power generation in favor of nuclear, coal, and gas. The Asian tigers and an industrializing China made Asia the new engine of demand growth — China flipped from net crude exporter to net importer in 1993, a historic inflection — even as the 1997–98 Asian crisis briefly crushed consumption and drove prices to about $12 in early 1999. Structurally, gasoline, jet fuel, and diesel became the absolute core of the barrel as fuel-oil power demand withered.
4. Stage III (2000–2010): China levers the commodity supercycle
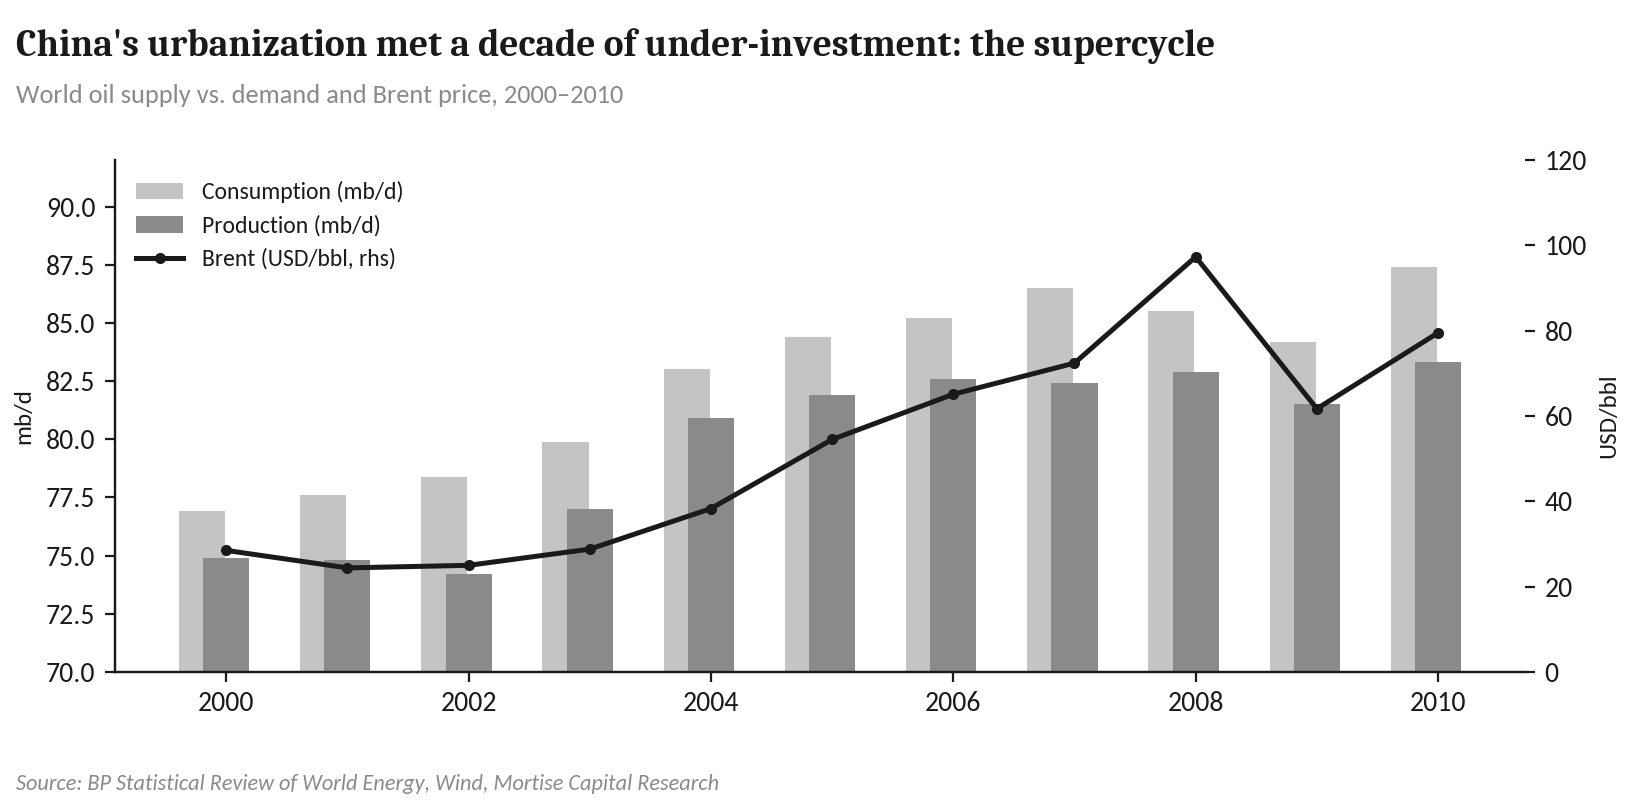
The core logic: unprecedented Chinese urbanization resonating with abundant global liquidity. After WTO accession in 2001, China’s urbanization rate jumped from about 36% to nearly 50% by 2010, driving infrastructure and property construction at scale; post-dotcom Fed easing and twin-deficit pressure put the dollar into a six-year depreciation. Chinese growth in this period was exceptionally energy-intensive — each unit of GDP consumed far more energy than it would later — so the marginal global barrel was effectively priced in Chinese demand.
Supply was hostage to the prior decade’s under-investment. Exploration and development spending lagged badly after the 1990s price trough, taking global spare capacity to historic lows by mid-decade. Against that thin buffer, the Venezuelan strike of late 2002 (output down ~60%) and the 2003 Iraq war widened the gap, returning pricing leverage to OPEC.
The demand center of gravity moved decisively east. Chinese crude consumption quadrupled between 1990 and 2008; China became the world’s second-largest consumer after 2003, with growth met almost entirely by imports — redrawing global trade flows. OECD demand peaked in 2005 and plateaued; virtually all marginal growth came from the non-OECD. Within the barrel, the construction and logistics boom made diesel growth persistently outrun gasoline, and Asian petrochemical build-out began to accelerate feedstock demand.
5. Stage IV (2010–2020): the shale revolution resonates with energy transition
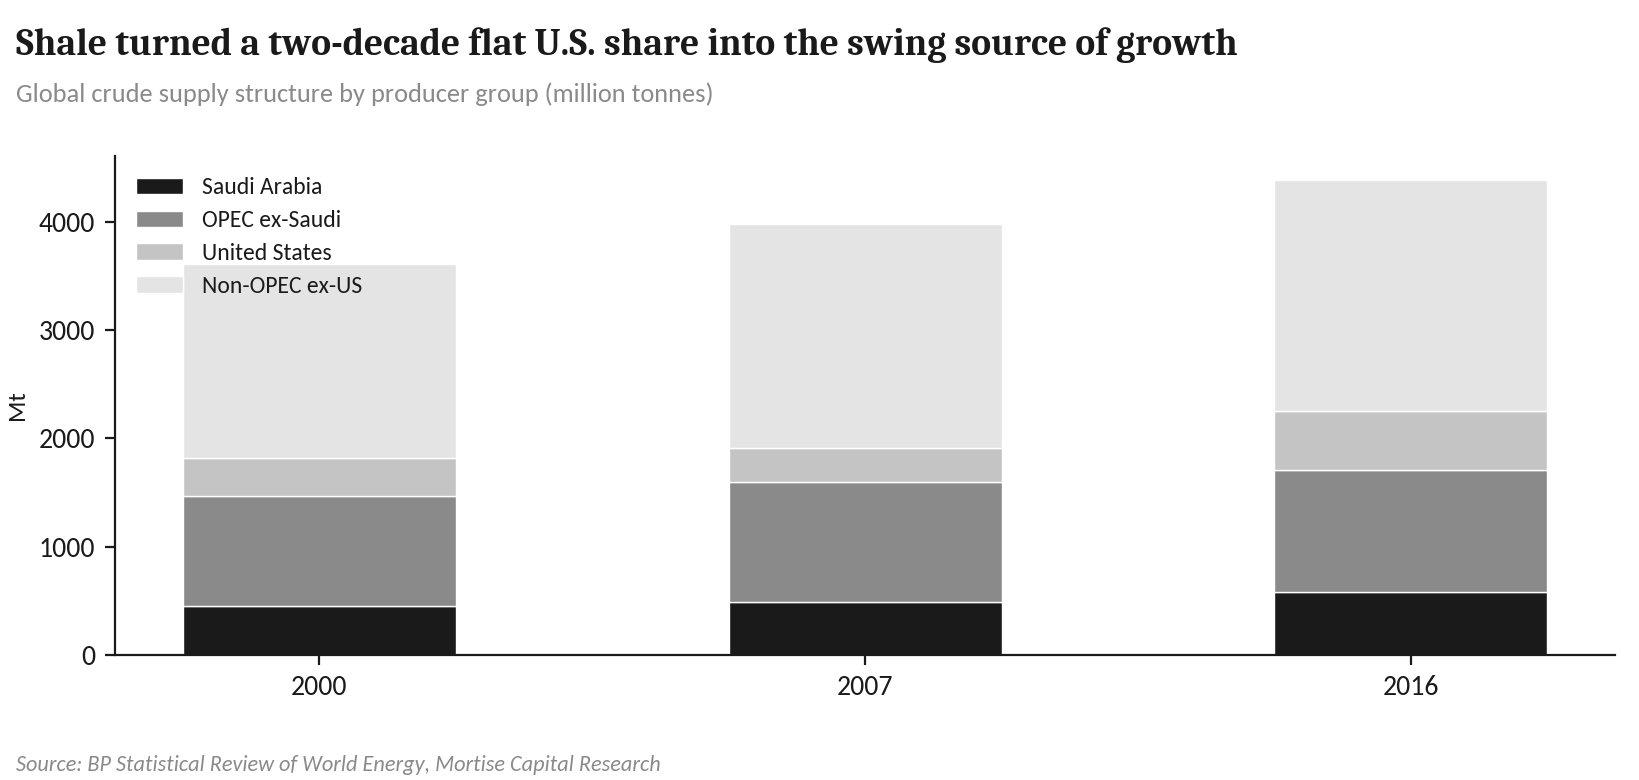
Post-GFC liquidity set the stage; $100 oil financed its own disruption. Competitive monetary expansion took prices to 90–100 USD/bbl in 2009–11, directly incubating the U.S. shale boom of 2013–14. U.S. shale output tripled from 2011 to end-2014, lifting the U.S. share of global supply from 7% to 12%; total U.S. production rose from about 5.4 mb/d in early 2010 to 9.5 mb/d by end-2014, concentrated in the Eagle Ford and Permian.
OPEC’s 2014 price war failed — and created OPEC+. Riyadh’s refusal to cut in 2014 drove crude from above $100 to $26 by early 2016, but shale’s short investment cycle let it hibernate and return. The episode produced the 2016 OPEC+ compact with Russia, and the supply regime settled into a dual structure: shale as the fast marginal supplier alongside coordinated OPEC+ cuts. By September 2017 OPEC still supplied about 42% of the world’s crude, but the U.S. had established itself among the top three producers with Russia and Saudi Arabia, and the shale cost curve became the de facto price anchor.
Demand began its structural pivot from fuel to feedstock. China still contributed roughly 40–50% of global demand growth in 2010–19, but its GDP oil intensity entered a linear decline as the economy shifted to its consumption-driven “new normal,” and its 2015 national EV strategy created the world’s largest electric-vehicle market. Per the IEA, petrochemical feedstocks — ethane, LPG, naphtha — accounted for about half of global oil demand growth across the decade, reflecting the modern economy’s rising dependence on lightweight materials, electronics, and pharma intermediates. The barrel’s fuel attribute weakened; its material attribute strengthened.
6. Stage V (2020–present): energy transition divergence in a reordering world
The macro regime itself is being rebuilt. Pandemic-era fiscal and monetary extremes pushed global inflation to 7.93% in 2022 and triggered the densest hiking cycle in four decades. Three deeper currents define the period: supply chains re-organizing from efficiency-first to security-first; the dollar system re-pricing after reserve freezes and the weaponization of SWIFT, with central banks buying record gold in 2022–24 and commodity trade increasingly settled in non-dollar currencies; and geopolitical risk shifting from black swan to embedded grey rhino — the Ukraine war, Red Sea re-routing, and great-power technology competition.
Supply: scarcity premium versus a multipolar production base. Russia’s 2022 invasion of Ukraine and the ensuing sanctions on a top exporter drove Brent to about $130; OPEC+ then held tight quotas through 2024–25 to defend price. But non-OPEC+ supply has been the structural story: record U.S. output of 13.6 mb/d in 2025, plus Brazil’s pre-salt FPSO delivery wave (Bacalhau onstream October 2025; new Buzios units due 2026) and Guyana’s Stabroek ramp toward 1 mb/d by 2027 — long-cycle deepwater and short-cycle shale arriving in resonance, much of it with cash costs below $35/bbl.
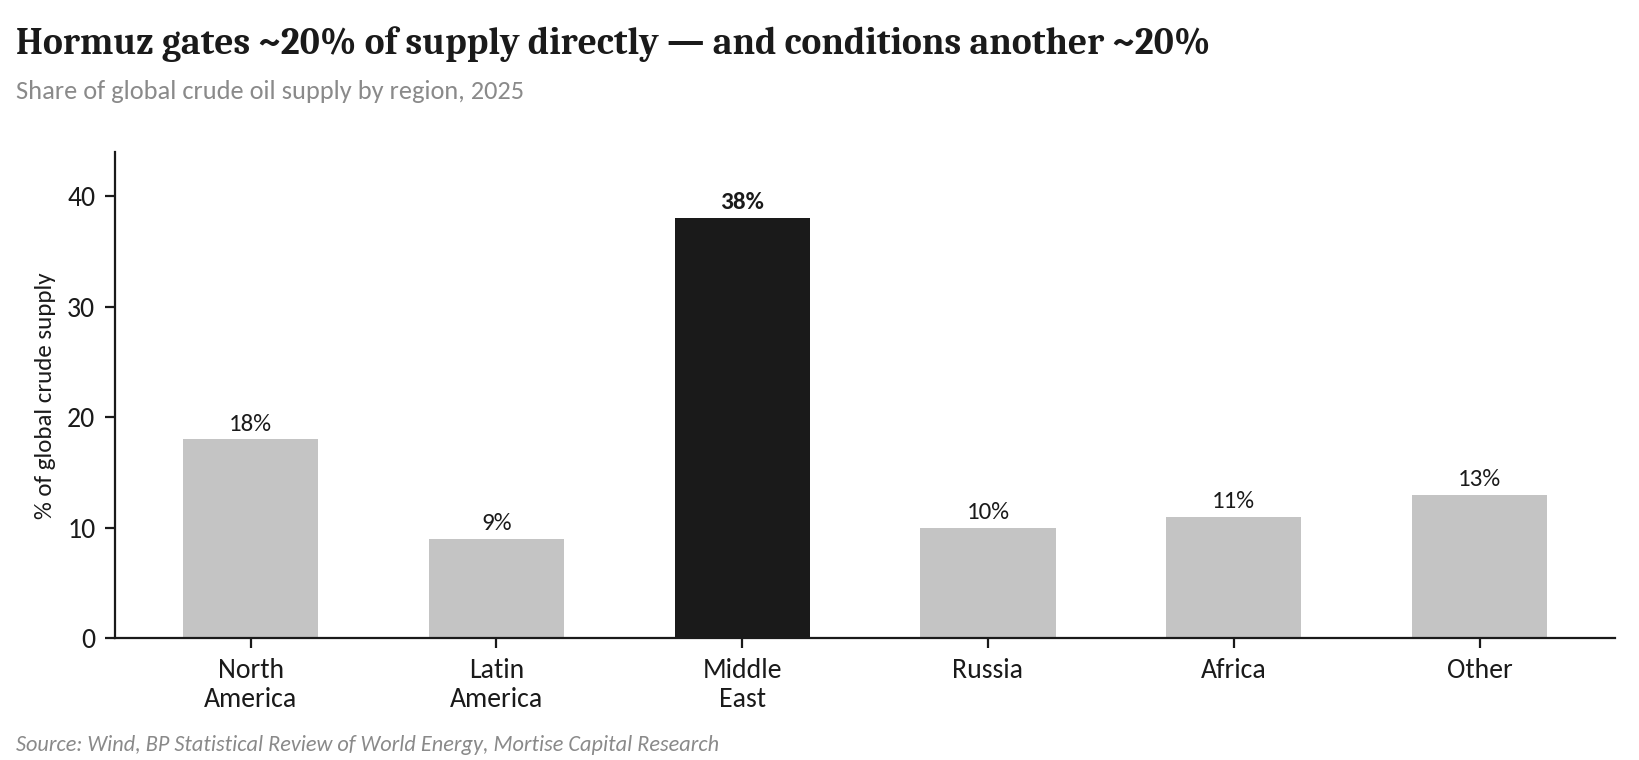
The 2025–26 U.S.–Iran conflict reads as the fourth post-war supply transformation — 1970s in direction, lower in intensity. The Strait of Hormuz directly gates roughly 20% of global crude supply and indirectly conditions another ~20% of Middle East barrels. A persistent, large-scale closure remains unlikely, so a sustained price explosion is not our base case; but a chaotic strait systematically raises the price center, because it is, in substance, a reduction of Middle East supply — against a macro backdrop (fracturing supply chains, dollar-system stress, political-economic realignment) that rhymes with the 1970s. Near term, the price path is a race between blockade duration and inventory depletion: unlike the West’s reserve vacuum of the 1970s, China’s large strategic stockpile now acts as the key buffer interrupting spot-market panic, but if a prolonged disruption breaches inventory red lines, a second price spike remains a live risk.
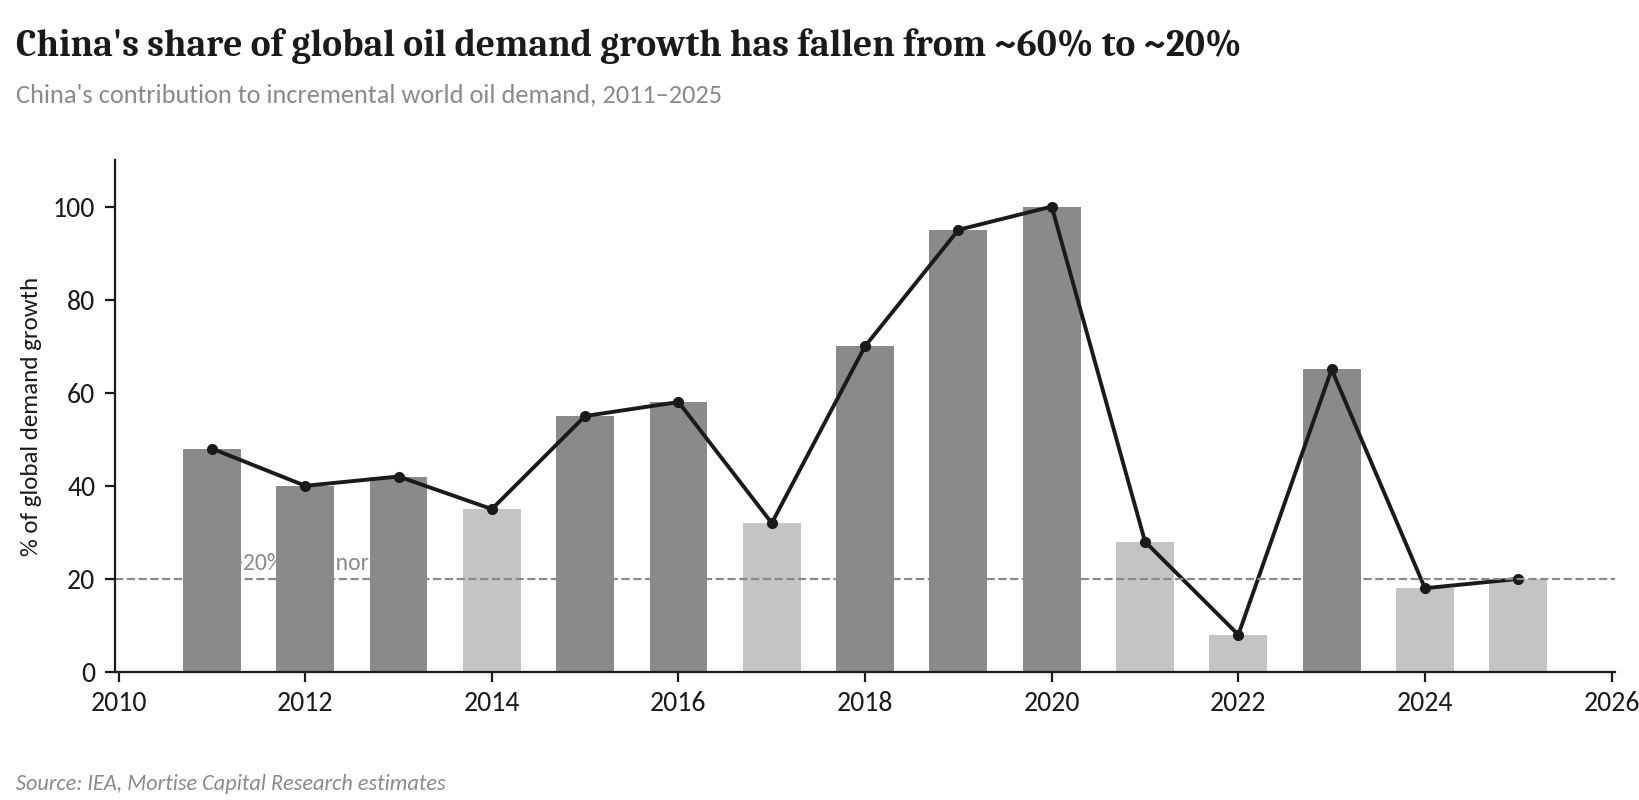
Demand: China’s fuel plateau passes the baton to South and Southeast Asia. China’s services transition and transport electrification — EVs exceeded 50% of passenger-car sales in 2024 — have put its oil fuel demand on a plateau, cutting its contribution to global demand growth from roughly 60% to about 20%. India supplied about a quarter of global oil consumption growth in 2024, marking a new “South Asia–Southeast Asia dual-core” phase that is embedded in China+1 supply-chain relocation, regional urbanization, and downstream petrochemical build-out rather than simple consumption arithmetic.
7. The structural laws of the price center
Law 1 — Every re-anchoring of the price center catalyzes a wave of industrial relocation
Each migration of the oil price center transmits cost pressure asymmetrically, pushing energy-intensive, low-value-added production from high-price to low-price geographies. Even a mild but persistent uplift is sufficient if it lasts: the center-shifts of the 1970s, 2010s, and 2020s each accelerated a round of global industrial transfer. Empirical work cited by CSC Research finds that a 1% electricity price increase reduces employment at non-adapting energy-intensive firms by roughly 1.5% — and the stronger response is relocation, not just contraction.
Law 2 — High prices cannot be killed, only displaced by new supply: marginal cost is the true anchor
The price center is set not by the lowest-cost producer (the Middle East) but by the marginal cost of the highest-cost barrel needed to clear the last unit of demand. Every high-price cycle has invited that marginal producer in — the North Sea, Prudhoe Bay, and the Gulf of Mexico after the 1970s; deepwater and, decisively, U.S. shale after the $100 era of 2010–14 — and prices ultimately settle back near those producers’ cash costs. Shale’s short investment cycle additionally flattened the global supply cost curve by speeding the supply response to price signals.
Law 3 — The rigidity-and-tolerance paradox lets high prices persist longer
Oil demand is tightly coupled to GDP, so demand destruction is slow even at elevated prices. The counter-intuitive corollary: every round of efficiency gains — falling energy intensity since 1970 — raises the economy’s tolerance of high prices, allowing the center to sit higher for longer without triggering systemic crisis. On CSC Research’s estimate, with today’s energy structure, pushing energy spending back to the 1970s systemic-risk threshold of 5–7% of GDP would require crude of roughly $150–220 per barrel. As intensity falls and demand shifts toward rigid petrochemical feedstock, the global economy’s “immunity” to $100+ oil has visibly strengthened — and if Middle East geopolitics extends along its current path, the new normal may be a price center both higher and more durable than history suggests.
Risk factors
• Policy intent and transmission may be read incorrectly; consumption recovery in major economies may stall at low levels.
• The property cycle’s tentative stabilization may not hold, capping industrial fuel demand.
• Tighter-for-longer Western monetary policy could drag on global growth and asset prices more than expected.
• Geopolitical escalation or de-escalation around Hormuz could move realized supply far from the base case in either direction.
• Faster-than-expected EV penetration and petrochemical capacity overbuild could pull the demand plateau forward.
Sources and attribution
Historical framework adapted from: CSC Research (CITIC Construction Investment Securities), “The Historical Saga of Crude Oil — Macro View on Commodities Series (7),” Chen Yi and Zhou Junzhi, June 10, 2026. Specific estimates attributed to CSC Research in the text — including the $150–220/bbl clearing band and the electricity-price employment elasticity — are theirs.
Data: BP Statistical Review of World Energy; International Energy Agency (IEA); U.S. Energy Information Administration (EIA); World Bank; Wind. Exhibits are constructed by Mortise Capital Research from these sources; series for 2025–26 are partly estimated.
This document is prepared by Mortise Capital’s research program for educational and informational purposes only. It is not investment advice, an offer, or a solicitation. Views reflect the authors’ judgment as of the publication date and may change without notice. Mortise Capital accepts no liability for losses arising from the use of this material.